My Life in 2020, Visualized

Information Design

Information Design

Information Design

Information Design

Information Design

Information Design

Information Design

Information Design
Information Design


Designer(s)
Rachelle Willemsma
Duration
52 Weeks
Recognitions
A year-long endeavour
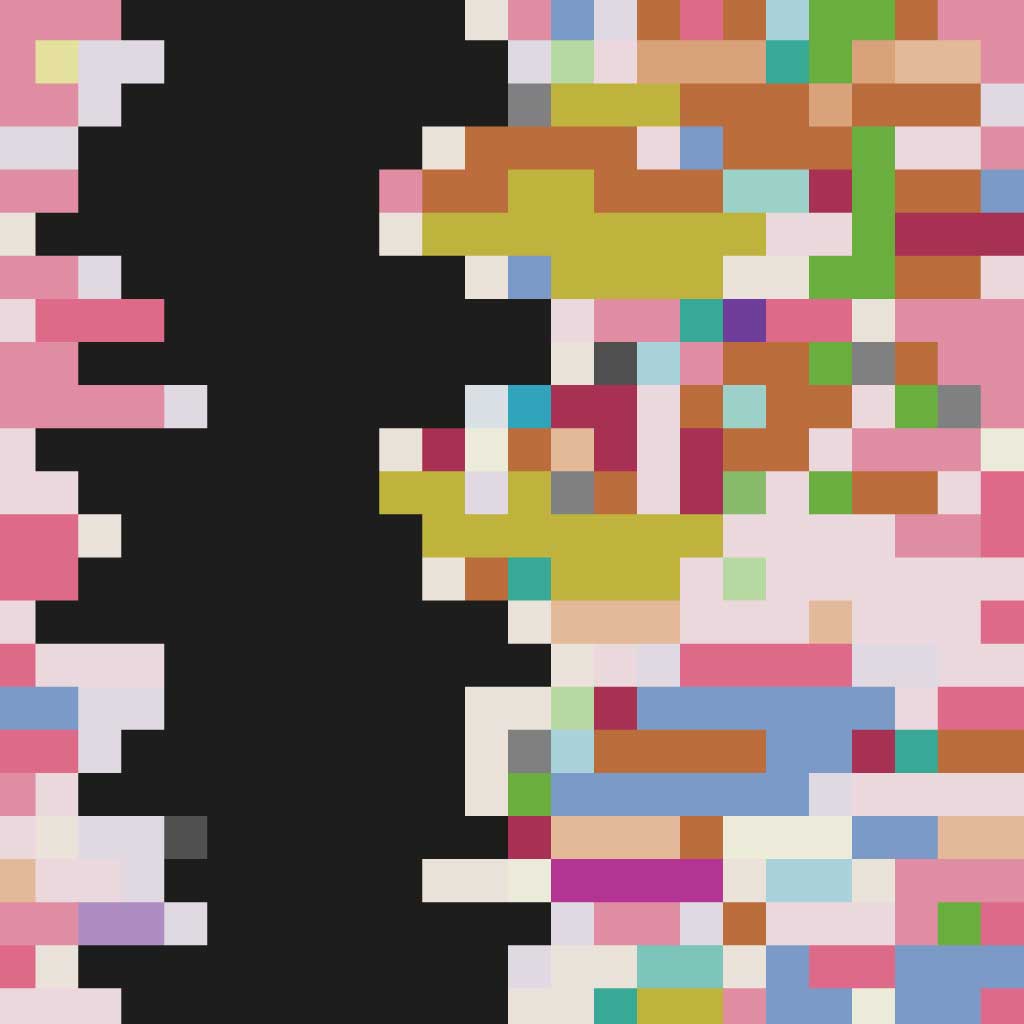
Before the start of 2020, I decided I would try to track what I would do each hour of each day of the following year. Little did I know how strange of a year it would be. What began as a fun side project became a way to assess the pandemic's effect on my life. Now, in retrospect, it serves as a keepsake of how I spent my hours during this unusual time. Reduced class time, cancelled commutes, social distancing and new hobbies all made their unique mark on this final visualization.
Social distancing :(
In addition to recording hourly activities, I also kept track of various other things throughout the year. This graph shows the number of people I spoke to in person each day on the right, compared to the number of people I called on the left. The numbers seen in this visualization include strangers and store employees. The sharp increase in calling is perhaps the most obvious trace the pandemic left on my tracking. My place of residence also had a huge effect on the number of people I spoke to daily, due to differences in the number of people I was living with in each location, and their social distancing habits.


